As the mobile app evolved we began adding more features that people wanted. But its origin truly was only to give us a way to easily enter mortalities into Grovestreams for record keeping and as required for the analytics engines.
Here is how the mortalities work:
Step 1, open the app.
Step 2, click the "Mortalities" icon
Step 3, select the group the mortality occurred in, the date and enter the found / euth.
The app then uploads the data via API transfer into Grovestreams where we can do all sorts of things with it. Some examples:
- Keep a running count of mortalities and inventory.
- Push the data into an enterprise level system through the API Transfer
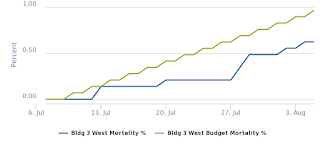
- Chart mortality %
- Chart mortality % versus budget
- Although I have not accomplished this yet it would be fairly easy to benchmark and chart each site's mortality against the entire system's mortality based upon the day/week in the turn.
- Accurately update various ratios such as: water gallons / pig with current inventory each day.
- Generate alerts from the mortality data. For example,
- alert when mortality goes above the budget and stays there for more than 7 consecutive days.
- alert when no mortalities are entered for 7 or more days.
- alert when more than 1% of the population is reported in a 3 day period.
I am outlining a lot of complicated reports and alerts that can be generated just to show readers the robustness of the system we have developed. In reality, most producers just want a way to submit mortalities from their cell phone or tablet and easily view the running total online or get the data into their own enterprise level system easier or faster. We are working on getting the running total back into the mobile app; but don't have that piece developed yet. Stay tuned.


No comments:
Post a Comment